Mutant Mass vs Optimum Nutrition Opti-Men
The published reviews of Mutant Mass and Optimum Nutrition Opti-Men, lined up: the five scores, what one serving delivers against the studied dose, the real cost per serving and what each label leaves out. Figures as of 28 September 2026.
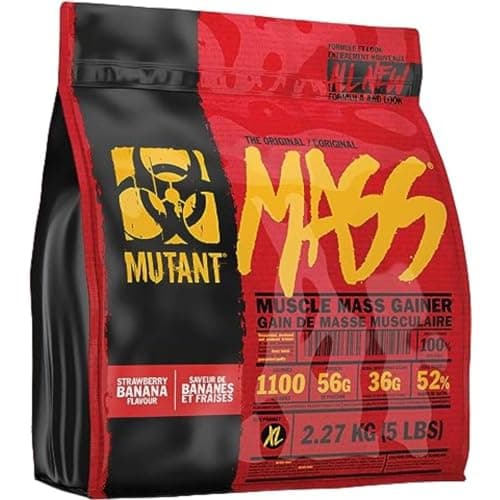
Mutant Mass
6.4/10
No dated price on file
Read the reviewAffiliate link: we may earn a commission at no extra cost to you.
Check the current price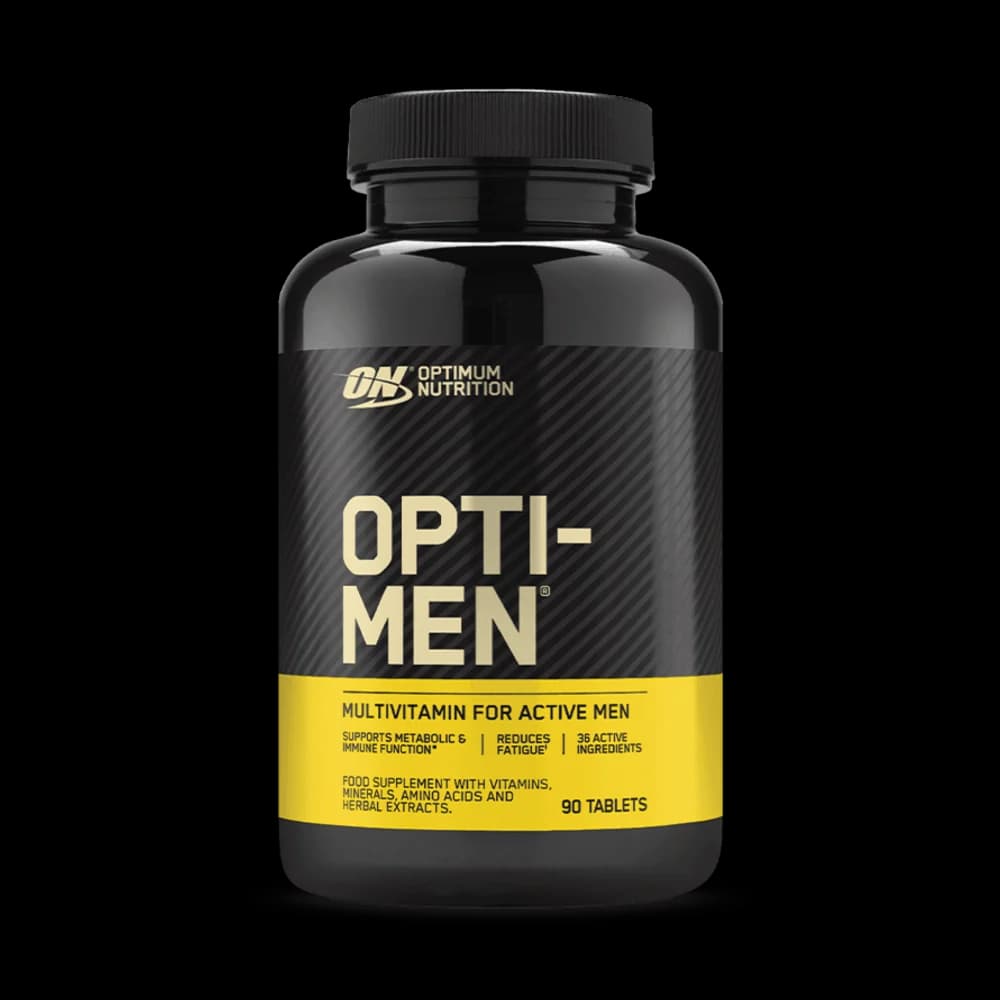
Optimum Nutrition Opti-Men
5.0/10
No dated price on file
Read the reviewAffiliate link: we may earn a commission at no extra cost to you.
Check the current priceThe short answer
Mutant Mass scores 6.4/10 against Optimum Nutrition Opti-Men's 5.0. The widest gap is evidence for the marketed claim: 7 for Mutant Mass, 4 for Optimum Nutrition Opti-Men.
Pick Mutant Mass if…
- you want the stronger evidence behind what it is sold to do
- you want better value against the plain generic version
- you want a serving that matches the amount used in research
Pick Optimum Nutrition Opti-Men if…
- tolerability and a well-characterised safety record come first
Criterion by criterion
The five criteria every review is scored on, published on the grading page. The overall score is their average.
Evidence for the marketed claim
How strong the research is for what the product is actually sold to do — not for the ingredient in general.
Dose against the studied amount
Whether one serving delivers the amount used in the research behind the claim.
Label transparency
Whether the Supplement Facts panel is published in readable text and every active amount is disclosed.
Value against the generic equivalent
Cost per gram or per dose of the active ingredient, compared with the plainest version of the same thing.
Safety and tolerability
Known risks and interactions, how well characterised they are, and whether the label warns about them.
Dose against the studied amount
What one labelled serving delivers, placed against the range on each ingredient’s evidence page. Where a label gives no figure, there is nothing to place, and that is the finding.
Whey protein blendEvidence A
Where muscle protein synthesis maxes out: 20–25 g a dose
- Mutant Mass56 g of protein per 280 g servingAbove range
- Optimum Nutrition Opti-MenNot in the formula
Vitamin DEvidence A
NHS daily amount to adult upper limit: 10–100 mcg a day
- Mutant MassNot in the formula
- Optimum Nutrition Opti-Men10 µg (200% NRV)In range
Folic acidEvidence A
USPSTF recommended range: 400–800 mcg a day
- Mutant MassNot in the formula
- Optimum Nutrition Opti-MenB6 5.4 mg, B12 9.0 µg, niacin 54 mg, folic acid 90 µg and others at 45–386% NRV
Green tea extractEvidence C
No single studied range in label units, so amounts are shown but not placed.
- Mutant MassNot in the formula
- Optimum Nutrition Opti-MenNot disclosed on the listings we could readUndisclosed
What it actually costs
Price divided by labelled servings, from a dated listing. A serving is whatever the label calls one, which is why the studied-dose row matters more than the headline figure.
- About £24.99–£36.99 for 2.27 kg and £54.95–£69.99 for 6.8 kg at mainstream UK retailers in listings read on 28 September 2026. No per-serving figure: servings not recorded.
- About £14.95–£19.99 for 90 tablets at UK retailers in search listings on 28 September 2026 — roughly 50p–67p a day. No per-serving figure: servings not recorded.
Label checks
What each label discloses, and what it leaves out. Read from the reviews, not from the marketing.
Mutant Mass
- Every active ingredient has a stated amount
- No third-party certification
- Whey protein blend: a serving gives 56 g, above the 20–25 g a dose where muscle protein synthesis maxes out
Optimum Nutrition Opti-Men
- 1 of 6 listed ingredients have no stated amount
- No third-party certification
How this comparison is built
- Scores are the ones already published in each review. Nothing is re-scored for the comparison, and a product leads a criterion only when it outscores the rest.
- Doses are read from the label rows in each review and placed against the studied range on the matching ingredient page. A figure that is not printed is never estimated.
- Costs use a dated retailer price divided by labelled servings. Prices in different currencies are never ranked against each other.
- Only products in the same category, or ones a review names as an alternative, can be compared. Commission never changes what appears here.